The invisible electric vehicle revolution - Part 1
Americans are embracing hybrids as much if not more than battery electric vehicles
This is the first post of a three part series on hybrid light vehicles in the US. This post shows that Americans are embracing hybrids and that the slightly higher cost of a hybrid compared to a traditional vehicle often pays for itself quickly. The second post will compare CO2 emissions of a hybrid to a BEV. The last post will highlight the disconnect between consumer preferences on the one hand and government subsidies and mandates on the other hand. This series is motivated by a tweet from CarDealershipGuy.
The battery EV revolution seems pre-ordained. We hear about S-curve adoption and inflection points. Governments are subsidizing and mandating them. Whenever adoption rates slow down, the media quickly reminds us that it’s a mere bump in the road to a fully electrified future.
Another electric vehicle revolution is taking place but receives far less attention: Americans are embracing hybrids.
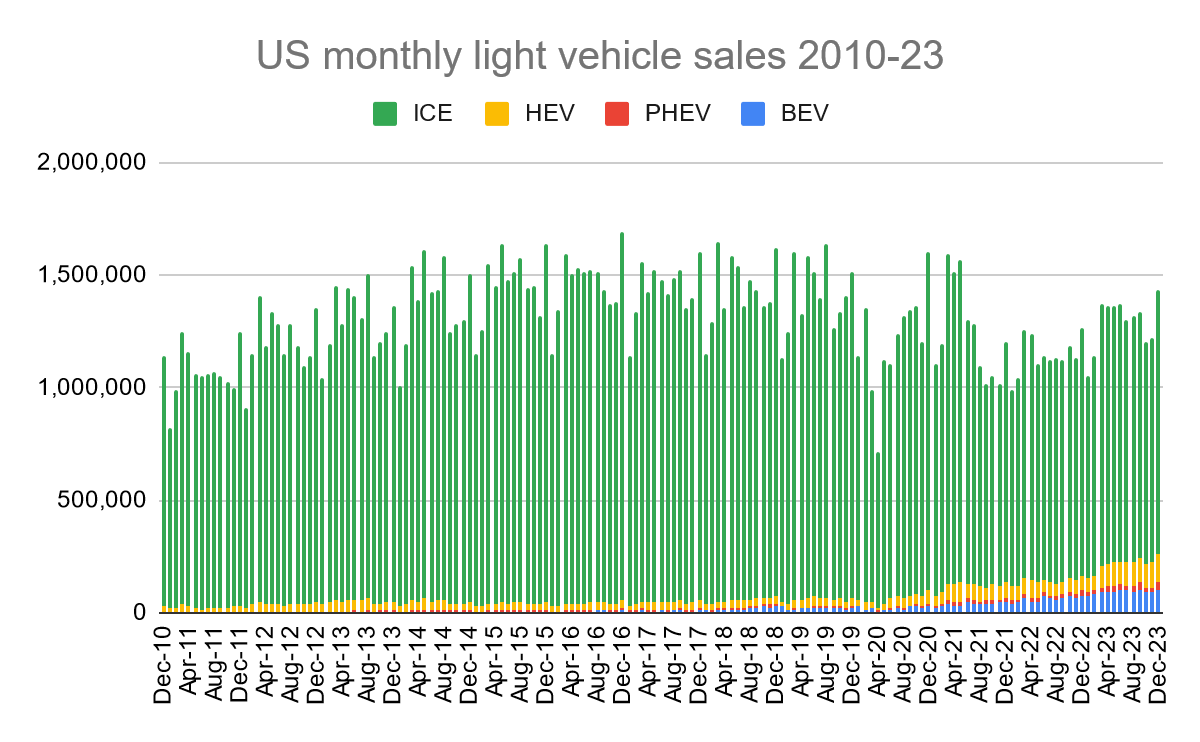
First some context1. About 1.3 million light vehicles (i.e. cars, SUVs and pickups) are sold in the US every month. Internal combustion engine (ICE) vehicles are the dominant technology. Hybrids (or hybrid electric vehicles, HEV), plug-in hybrid electric vehicles (PHEV), and battery electric vehicles (BEV) are quickly gaining market share, albeit from a low base. Here’s how sales of light vehicles in the US have evolved between December 2010 and December 2023:
ICE sales still account for over 80% of total light vehicle sales and showing them obscures how much electric vehicle sales have recently gone up. Removing ICE vehicles from the graph, we see that electric vehicle sales have about quadrupled since early 2020.
The well-known narrative is that BEVs are following an S-shape adoption curve and that drivers are transitioning from ICEs to BEVs. The reality is more complex.
The next graph shows market shares. We do indeed see that BEVs have increased their market share from less than 2% before the pandemic to 7-8% recently. But what might not be as well understood is hybrids’ market share has grown from 2-3% before the pandemic to 8-9% recently As a matter of fact, hybrids have been outselling BEVs every month since March 2023.
Why do consumers buy hybrids? Here are some reasons provided by The Ride Share Guy:
You may have noticed from reading this listicle that I’m a fan of hybrids, and you’re right. That’s because not only do they use a lot less gas, saving you money and extending your range, but they also love stop-n-go city driving. Hybrids have a lot more pep off the line and are cheaper to maintain: brakes and transmissions last much longer than conventional cars. It’s the next best thing to an EV.
They also don’t require any modifications to a driver’s lifestyle.
If gas prices are average or high, buying a hybrid (instead of the equivalent ICE model) “pays for itself” fairly quickly. The chart below shows how many years a hybrid needs to be driven before breaking even based on a few Toyota models and gas prices2.
For instance, Toyota offers its Corolla LE at $21,900 and its hybrid version for $1,400 more. The hybrid has much better city fuel economy (53 vs 32 mpg) and somewhat better highway fuel economy (46 vs 41 mpg) and saves 93 gallons or 28% per year. If gas prices are $4 a gallon, the hybrid version “pays for itself” in less than 4 years.
For some models, the hybrid version seems a poor investment: the RAV4 LE hybrid costs $3,000 more than the ICE and it would take 8 years to break even at $4 gas.
But for other models, the hybrid is a no-brainer. Even at $2 gas, the Highlander LE hybrid breaks even in less than 6 years — the hybrid costs only $1,600 more than the ICE but saves an impressive 144 gallons per year. If gas were to average $5, the hybrid would break even in a little more than 2 years.
To summarize, Americans are currently buying more hybrids than battery electric vehicles. The additional cost of a hybrid over an ICE “pays for itself” fairly quickly for many models thanks to gas savings.
In the next post we’ll compare these technologies on CO2 emissions.
All data in this section comes from the “Light Duty Electric Drive Vehicles Monthly Sales Updates - Historical Data” page of the Argonne National Laboratory. The data covering December 2010 to December 2023 is available here.
Methodology:
I compare Toyota models because because Toyota is the company most associated with hybrids, they offer hybrid versions of their ICEs (allowing apple-to-apple comparisons), and their website provides all the information needed to compute breakevens (price, city fuel economy, and highway fuel economy). If you are curious how quickly other makes or models break even, please leave a comment.
For simplicity, I assume $0 financing costs for the additional costs of the hybrid version. I also assume the hybrid version behaves exactly as the ICE except for fuel economy, and drivers doesn’t change their behavior.
I assume 55% city driving and 45% highway driving (fueleconomy.gov).
I assume 11,642 miles driven per year for cars and SUVs (GWU study).


I doubt that battery only vehicles will survive in the long run barring some sort of technical breakthrough. People need to get over their fantasy that they are emission free. Refer to them as “coal fired cars.”
This is such a fascinating and useful stack. Thank you.
In UK our gas prices are more like $12 a gallon. Imagine that America: Over twice as much! It's a government tax cash cow and they milk it for all its worth.